
As i write this blog the Met Office has issued a yellow warning for rain. As i look at the statistics from our local rain gauge we have had 85mm of rain in Sheffield for July, with an annual 666mm so far.
If I compare this to the 2007 event where we saw 70.6mm of rain fell on the 25th June, this year on th 6th July we had 37mm of rainfall, so although people were concerned about flooding we didnt recieve the same level of rainfall.
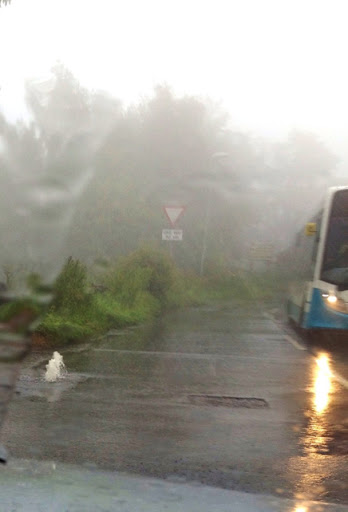
Yet we saw a lot of overland flow flooding like in the photograph opposite,may people dont realise that sewers are only designed for a 30year event. This type of flooding quite often floods properties before riviers burst their banks, as a river takes some time to respond to flooding, where as local drainage systems can respind quicker to intense rainfall due to their smaller catchment areas.
What many people havent realised it is that in the UK our flood zones are very well mapped. We know the areas which will flood and at what thresholds these flooding events occur.
 The flood map to the right is a screen grab from the Environment Agency's website. The dark blue is the 100year floodplain which is where the risk of flooding is 1% in any one year. Whereas the light blue is the 1 in 1000 year flood envelope where there is a 0.1% change of flooding in any one year.
This is accessible from the Environment Agency and you can look at your flood risk on the following link http://maps.environment-agency.gov.uk/wiyby/wiybyController?ep=maptopics&lang=_e